Wouldn't it be great if you could type math anywhere, in any app, with the same self-evidence as other text? With Formalize for iOS, you can!
A MathLapse is a short educational video on a mathematical topic. For the MathLapses presented at the IMAGINARY conference 2016 in Berlin, I used SceneKit to animate the formula for the surface area of a sphere. It won 6th place out of 45 submissions.
This app came out of a personal necessity to ditch the blackboard for the most lightweight alternative possible. OH Writer offers a number of functions that the built-in camera app does not, without any UI visible to the audience.
I am a big fan of the Crash Course YouTube series, and was especially excited when Crash Course Physics started. For a while, I posted weekly reviews ("Physics Nitpicks"), mainly as a personal creative outlet.
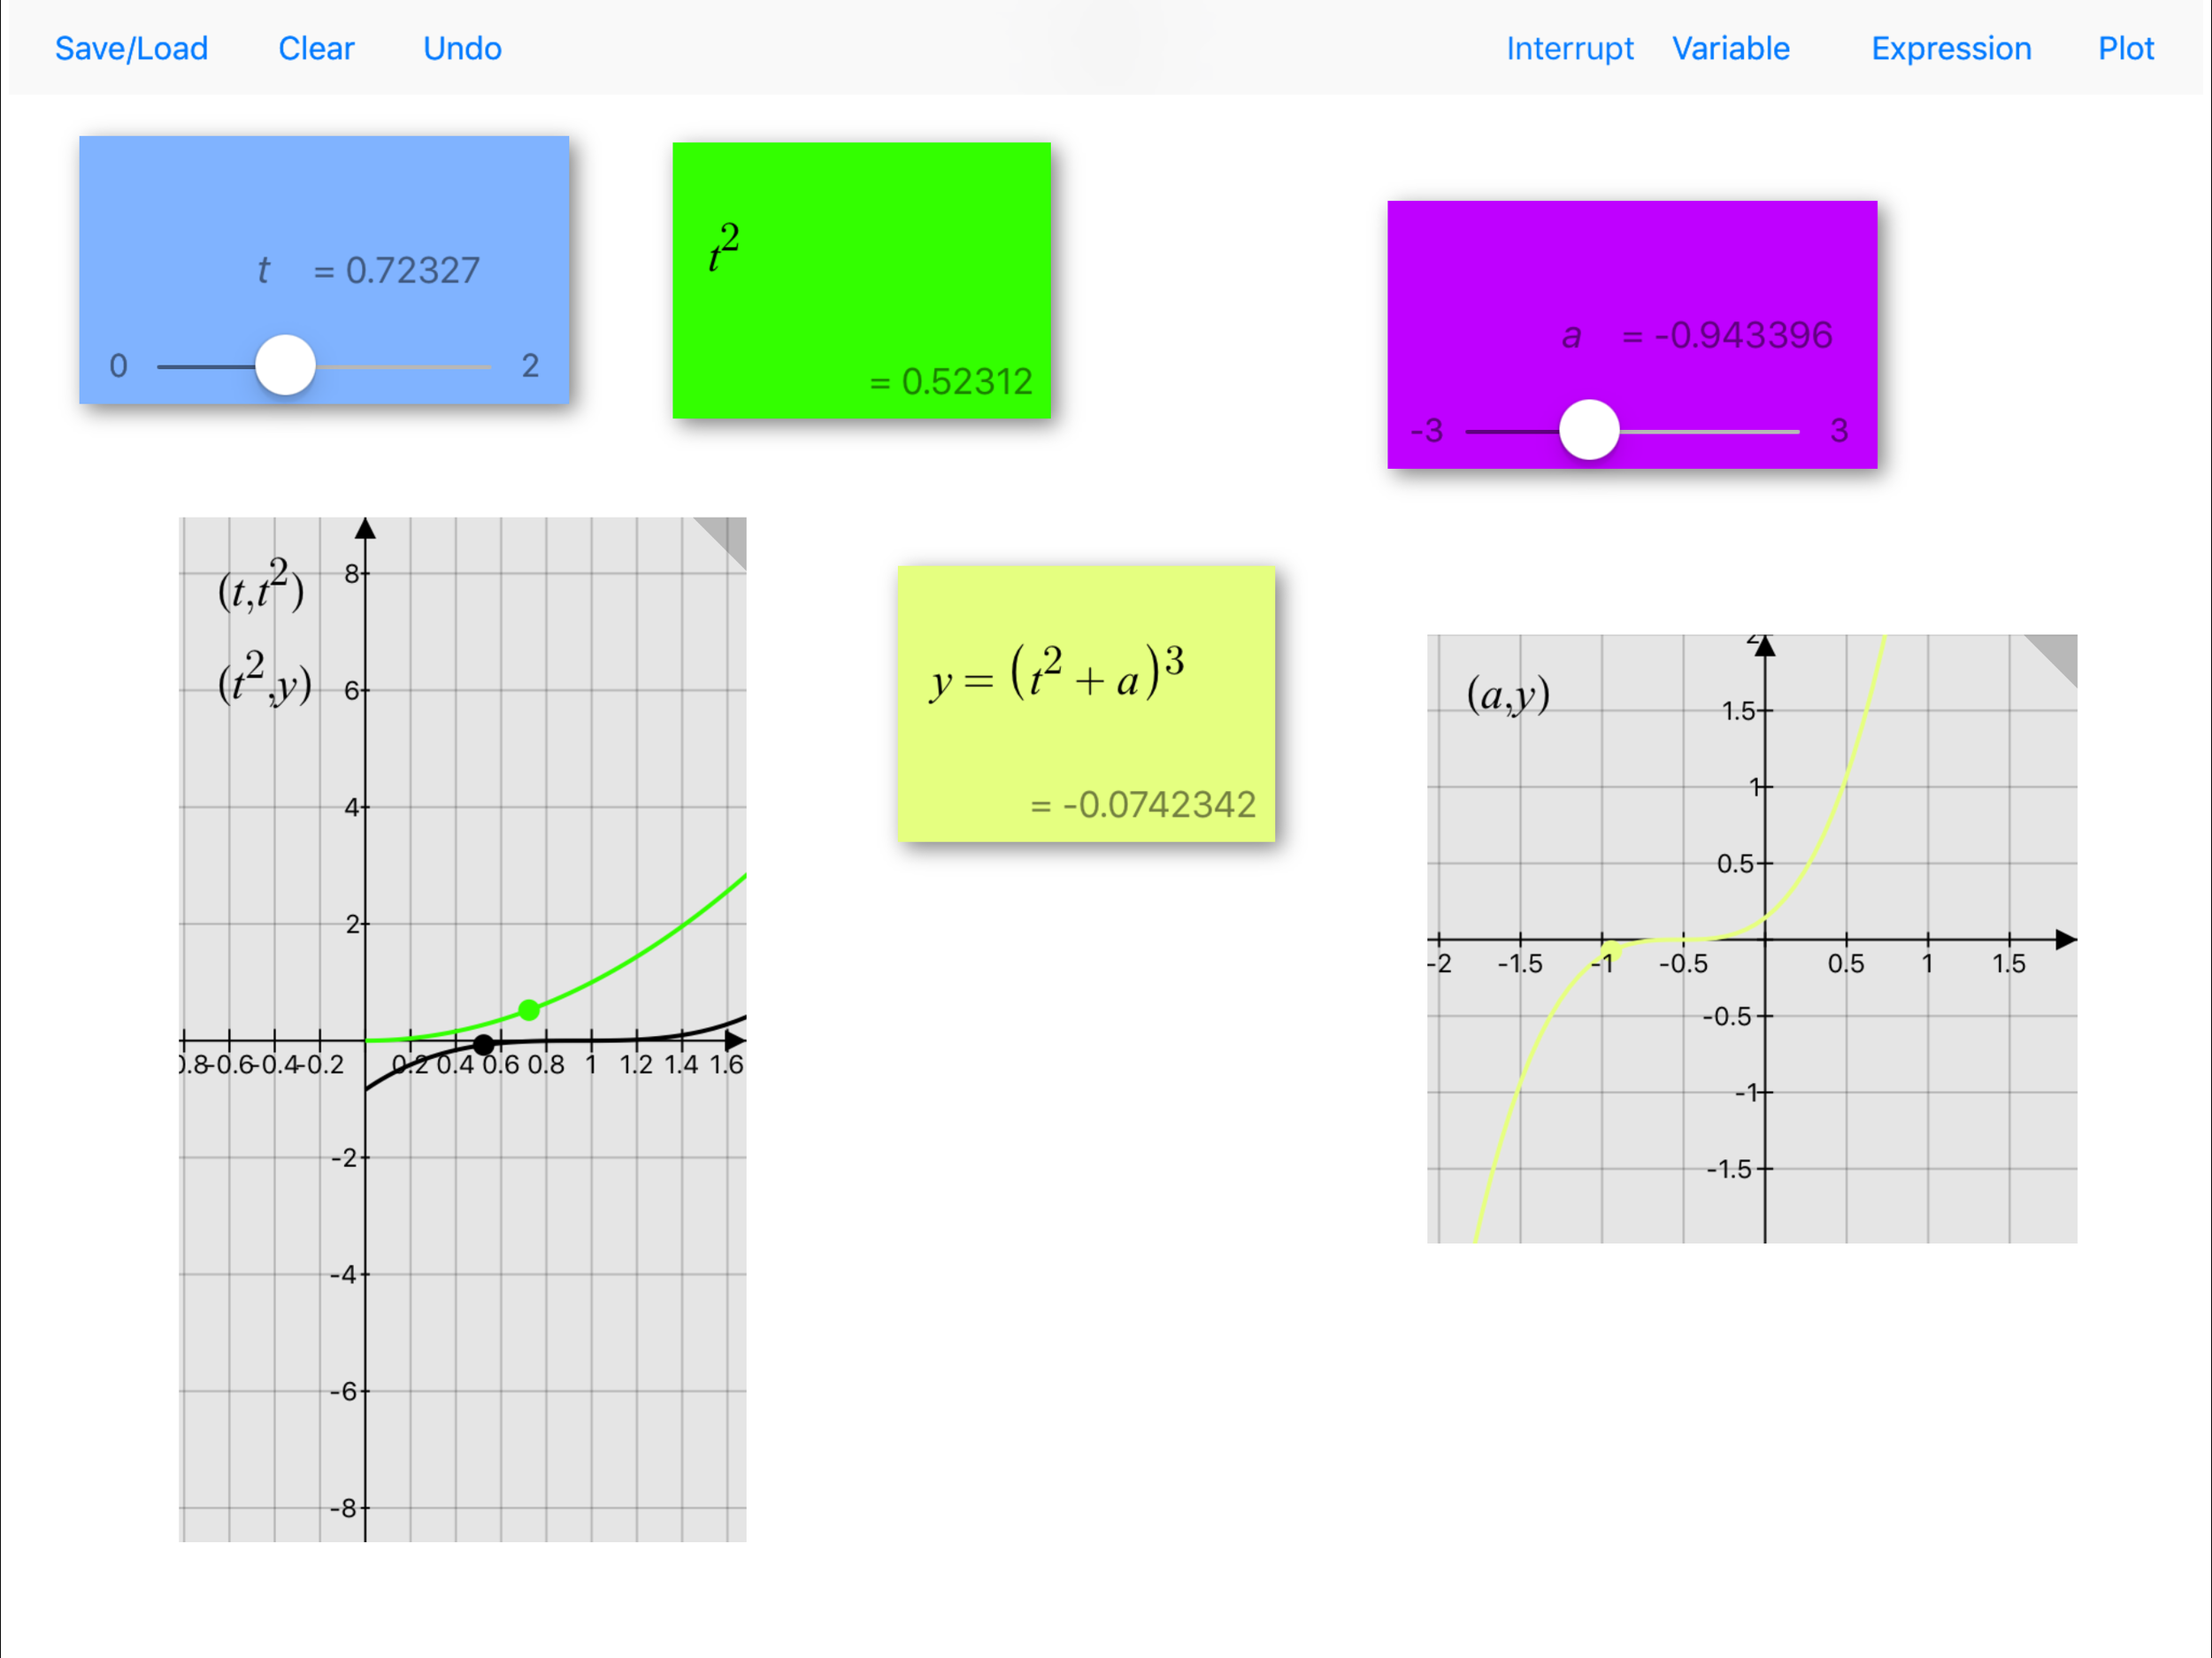
A novel kind of graphical calculator for iPad. It takes the functional aspect in mathematics front and center: create variables, expressions and graphs as freely arrangeable boxes on a canvas. Sliding a variable value immediately changes all depending expressions and graphs. Includes save and undo functionality.
Alfy is unfinished as of now.
This was a result from my time as a PhD student in the group of Alain Aspect. It confirmed a basic theoretical model of electrical resistance by using cold atoms instead of electrons and imaging their distribution. My contribution consisted of numerical simulations using FORTRAN and Matlab.